


How Summary Tables Transform IoT Data into Actionable Insights
Roy's eyes darted across the cluttered spreadsheet on his computer screen, his brow furrowing in frustration. As the facility manager for a sprawling commercial complex, he was drowning in data from various building systems – HVAC, lighting, security, and more. But making sense of it all? That was proving to be a Herculean task.
"There has to be a better way," Roy muttered, rubbing his temples. He had just spent the better part of an hour trying to compare energy usage across different zones, looking for inefficiencies. But the data was scattered across multiple sources, making it nearly impossible to spot patterns or anomalies quickly.
His phone buzzed - another alertabout an overheating server room. Roy sighed, knowing he'd have to manually cross-reference several systems to diagnose the issue. As he stood to investigate, he couldn't help but wonder: In this age of smart buildings, why did he still feel so uninformed?
Little does this fictional facility manager know, he – nor any other facility manager in the modern age – truly doesn’t have to be uninformed. Cloud-based building management systems(BMS) collect more data than ever before and store it all in one central place, accessible onsite or anywhere with an Internet connection. With APIs,this can also include information from systems not controlled by the BMS, such as security or fire alarms.
With all this data, one can imagine that even having a central portal for all of it to live in wouldn’t keep information overload at bay. Plus, wouldn’t having multiple spreadsheets open at once just be replaced with clicking between multiple browser tabs when trying to cross reference system information?
At 75F, we solve this with a powerful and elegantly simple feature: summary tables.
Summary tables are a simplified way to visualize building data. They offer a condensed view of system statuses, parameters, and performance metrics across various levels of a building or zone. But to truly appreciate the power of this feature, let's break it down further:
What are Summary Tables?
Located in75F's user portal, Facilisight,summary tables are a simple and better view of the status and details of a system/building/zone. It can define and display parameters at different levels of a system/building/zone and further help in easy management and troubleshooting.
One of the most potent aspects of summary tables is their adaptability. Users can select tables tailored to applications, enabling them to:
View real-time statuses of zones or systems at a glance
Get a comprehensive overview of any part of the building
Easily compare performance across different systems or zones
Quickly troubleshoot discrepancies or issues
For someone like Roy, this means no more juggling multiple spreadsheets or jumping between different system interfaces. All the critical information he needs is available in one place, organized exactly how he needs it.
Types of Summary Tables
Understanding that different users have different needs, Facilisight includes shared tables for common use cases, some of which include:
HyperStat Conventional Package (CPU) Table
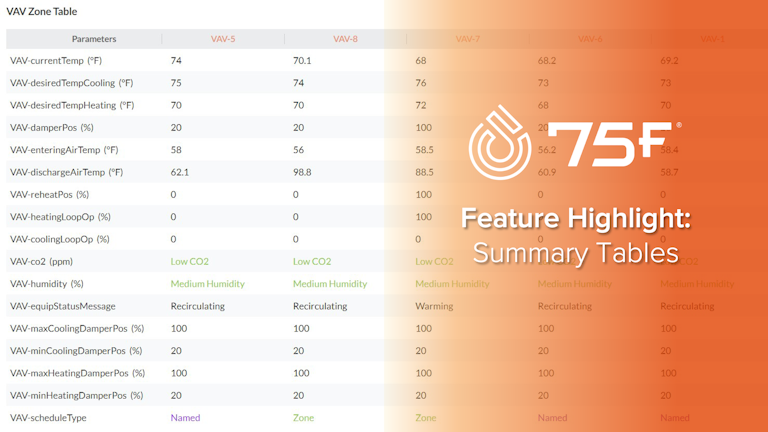
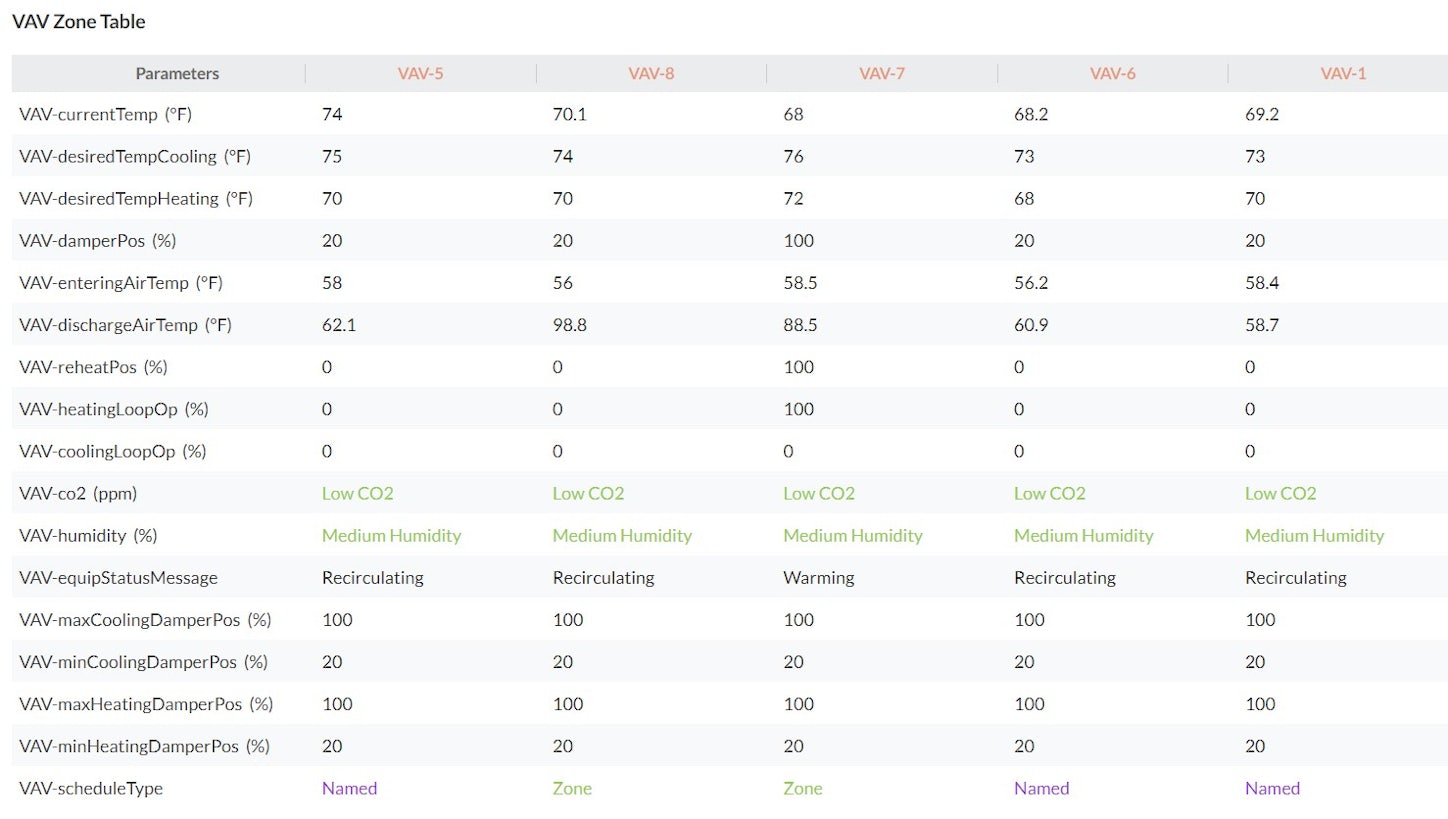
VAV Zone Table
DAB Zone Table
These tables include information ranging from desired and actual temperatures to damper positions and equip statuses.


75F tags all its data according to Project Haystack, a widely used open-source initiative for standardizing semantic data models in building automation. This means that summary tables can be built using these standardized tags, ensuring all data linked to the requested tag is visible in the table. By utilizing this Haystack flexibility, summary tables offer a powerful combination of ease-of-use and data integrity, allowing 75F’s support team to quickly build tables and letting building managers see tables that accurately reflect their specific needs and system configurations.
If this all still sounds complicated, users can always ask 75F’s conversational AI assistant, Saffron AI,to generate the summary table that best suits their use case.
Once a facility manager has the right data in front of them, summary tables can go a step further. Roy and others like him can easily share their insights with others, including maintenance teams. The next time Roy has malfunctioning HVAC equipment, he can download a summary table and send it to his preferred contractor before they even get on site. This feature bridges the gap between data and action, ensuring that everyone has the information they need to make informed decisions.


Healthier Buildings Series: Real Estate Strategies in Times of Uncertainty
Commercial real estate is in a completely different landscape today than it was 12 months ago.

75F Makes IntelliPak RTU Integration Simple in High-End Office Space
Hubbell Realty installed 75F's IoT Building Management System with goals to set a flexible foundation for future building upgrades.