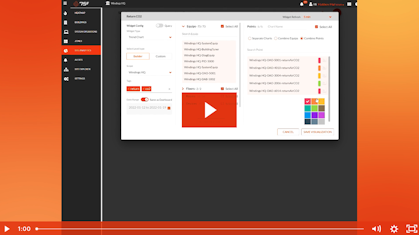
75 Seconds or Less: How to Create a CO₂ Trend Graph
Learn how you can track your building's CO₂ levels through custom intervals in 75F's user portal, Facilisight.
Unsupported Browser! This website will offer limited functionality in this browser. We only support the recent versions of major browsers like Chrome, Firefox, Safari, and Edge.
Take control of your building portfolio like never before with data analytics that can customize, integrate, and share across platforms. Our advanced software harnesses the power of data and the cloud to provide dynamic insight into energy data across a portfolio and flexible control over the information users see through customizable, shareable dashboards and widgets.

Use 75F's preconfigured charts or build your own using any of our available widgets to see your building in a unique light.

Take advantage of unprecedented real-time insight to diagnose building issues, understand trends, and so much more.

Keep your internal and external stakeholders in the know with custom dashboards made just for them, shared with private links or embedded iframes.
Gain a comprehensive view of your data with the ability to visualize and compare energy and indoor air quality metrics across your entire portfolio, individual sites, zones, and equipment. Easily identify outliers and areas for improvement.
Access up-to-the-minute, pre-tagged data from your buildings, ensuring you have the most accurate and current information to make informed decisions, diagnose alerts, and build trend charts across a portfolio.
Tailor your analytics experience to your specific needs using any data point collected with 75F's system. Create custom charts and dashboards to focus on the metrics that matter most to you and your stakeholders.
Share insights with team members, clients, or stakeholders using shareable links, downloadable data, or embedded iframes to drive alignment towards ESG goals or help contractors understand site issues faster.

Learn how you can track your building's CO₂ levels through custom intervals in 75F's user portal, Facilisight.

The 75F HyperStat works out of the box with our complete sensor suite, and is Haystack native and BACnet compliant to support healthy, comfortable spaces.

Discover how IoT makes attaining your first step toward defining corporate ESG goals that much easier.

Enhance efficiency with IoT BMS and integrated automated building systems. Monitor, control, and optimize your building's operations for smart, sustainable management.