


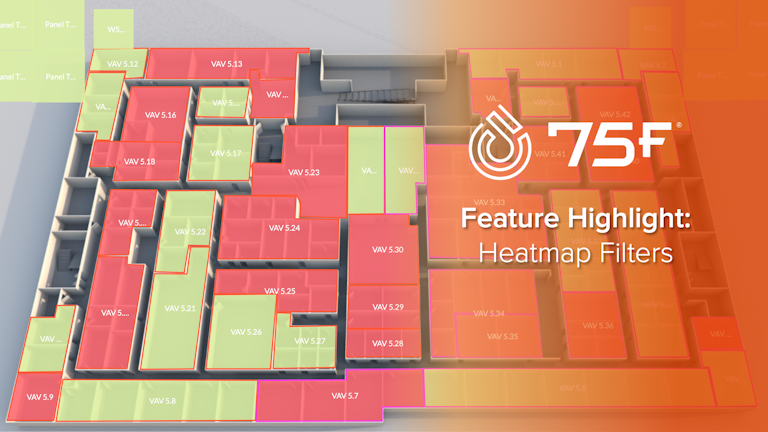
Leveraging Heatmap Filters for Deeper Facility Data Analysis
Amy furrowed her brow as she hung up the phone. As the owner of a thriving chain of salon suites, she prided herself on providing top-notch facilities for her stylists. But lately, a chorus of discontent had been rising from one location.
"It's stuffy in here," her stylists kept saying. Amy knew that comfort was crucial in their line of work, but without more specific information, she felt powerless to address the issue effectively.
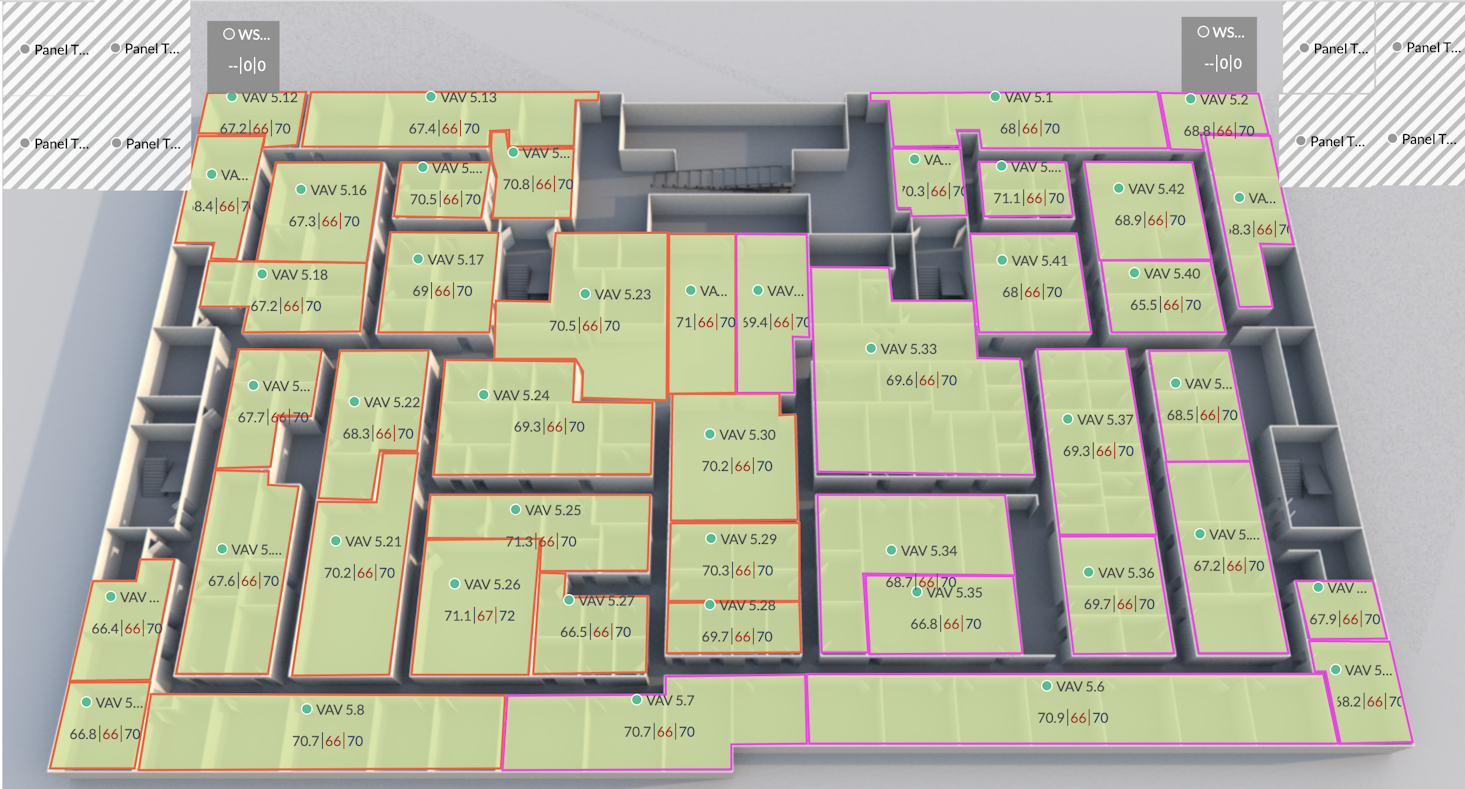
Determined to find the underlying cause of the problem, Amy logged into her 75F Facilisight dashboard. The temperature heatmap showed normal ranges across all zones, leaving her momentarily stumped. Then, she remembered a powerful tool at her disposal: heatmap filters.
With a few clicks, Amy applied a custom CO₂ filter to her salon's layout. Suddenly, a visual story unfolded before her eyes. The reception area blazed an alarming red, indicating unusually elevated levels of carbon dioxide. She switched to an occupancy filter, but the numbers looked normal for a typical day.
A lightbulb went off in Amy's mind. Could there be an issue with the rooftop unit's economizer? This insight, made possible by the heatmap filters feature, gave her a clear direction for investigation and resolution.


Unlocking the Power of Heatmap Filters
Amy's fictional experience is just the beginning when it comes to the capabilities of Facilisight's heatmap filters. This versatile feature empowers users to visualize a wide array of data points across their entire facility, transforming complex information into intuitive, color-coded maps.
Let's explore some of the filters available to Facilisight users:
CO₂: Pinpoint areas with poor ventilation or high occupancy
VOCs: Track volatile organic compounds to maintain healthy air quality
Occupancy: Visualize space utilization patterns across your facility
Humidity: Monitor moisture levels to prevent mold growth
Firmware versions: Easily spot devices running outdated software that may need updates
Received Signal Strength Indicator (RSSI): Understand which devices have stronger signals than others
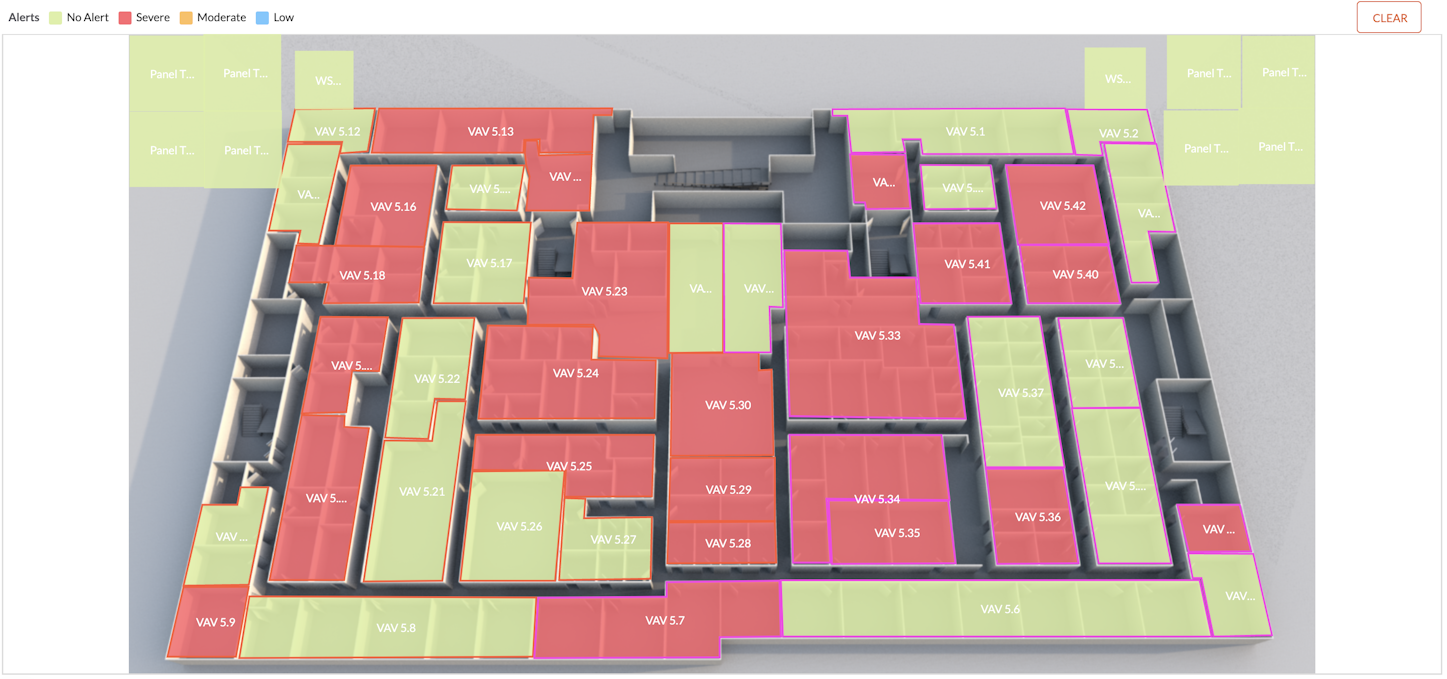
Alerts: See which zones have active alerts, color coded by severity
The beauty of heatmap filters lies not just in their variety, but in their customizability. Users can create personalized filters tailored to their specific needs and concerns with any data point that 75F collects. Even better, these custom filters can be shared across an organization, fostering collaboration, and ensuring everyone has access to critical insights.
For instance, Amy could share her CO₂ and occupancy filters with her maintenance team, allowing them to quickly get a sense of the problem. This shared intelligence leads to faster problem resolution and more proactive facility management.
The Haystack Advantage
Underpinning the seamless functionality of heatmap filters is 75F's universal use of Project Haystack data tagging standards. This uniform approach to data organization might seem like a technical detail, but its impact on user experience is profound.
Imagine trying to implement a similar feature in a traditional building automation system without standardized data tagging. Engineers would need to manually map each data point, a time-consuming and error-prone process that would need to be repeated for every new building or system update.
With Project Haystack tagging, 75F Facilisight can automatically populate filter options with relevant data points. This means that features like heatmap filters can be deployed quickly and easily across diverse building types and systems. The result? A more intuitive, responsive, and powerful building management experience.
Empowering Proactive Facility Management
As Amy discovered, Heatmap Filters do more than just solve immediate problems - they transform the entire approach to facility management. By providing clear, visual insights into building performance, this feature enables users to:
Identify patterns from a birds-eye view
Make data-driven decisions about maintenance and upgrades
Enhance occupant comfort and productivity
Communicate more effectively with stakeholders using easy-to-understand visuals
In today's complex building environments, the ability to quickly visualize and analyze multiple data points is not just helpful - it's essential. Heatmap filters put this power into the hands of facility managers, business owners, and maintenance teams, regardless of their technical expertise.
From small businesses like Amy's salon suites to sprawling corporate campuses, Heatmap Filters are changing the game in building management. By turning data into actionable insights, this feature empowers users to create smarter, more comfortable, and more efficient spaces.
Facilisight features don't end here.


Healthier Buildings Series: Real Estate Strategies in Times of Uncertainty
Commercial real estate is in a completely different landscape today than it was 12 months ago.

75F Makes IntelliPak RTU Integration Simple in High-End Office Space
Hubbell Realty installed 75F's IoT Building Management System with goals to set a flexible foundation for future building upgrades.